| Year: | 2022 |
| Tools: | InDesign, Illustrator, Photoshop, Acrobat |
| Fields: | Graphic Design, Research Visualisation, Book Editing & Publishing |
Download the free interactive e-book (PDF) via TU Delft Open Publishing.
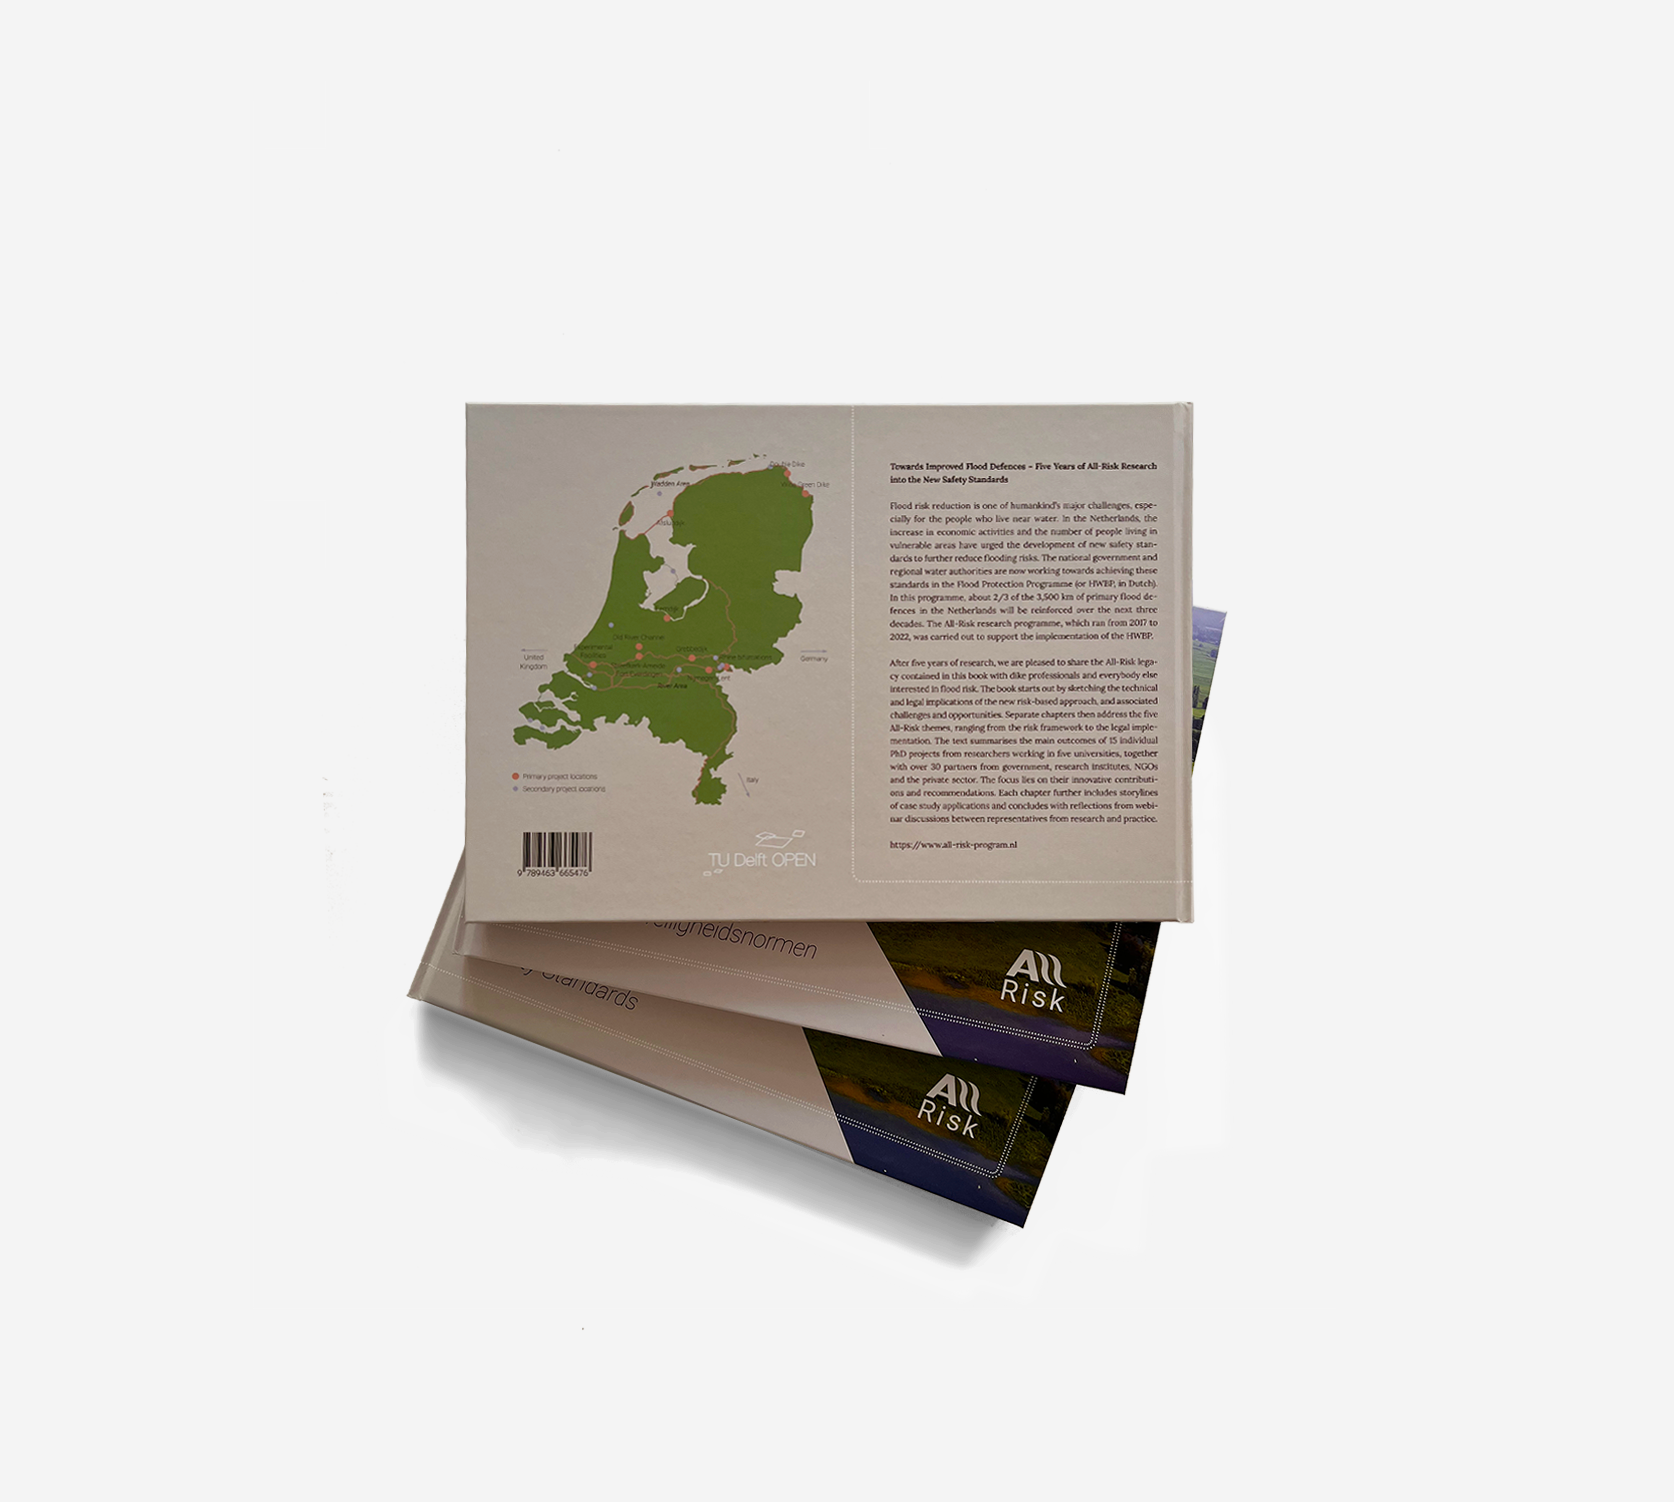
In the Netherlands, the increase in economic activities and the number of people living in vulnerable areas have urged the development of new safety standards to further reduce flooding risks. The Flood Protection Programme (or HWBP, in Dutch) commissioned a consortium of 5 universities and partners to research these new safety standards.
After four years of research, with the program coming to an end, I was asked to participate in the creation of a book containing the legacy of the All-Risk research program. The basis of the program was formed by 15 PhD projects, divided into 5 themes. These projects were elaborated on with the help of case study applications, webinar reflections and academic background articles. How to bring all these different kinds of contents together into a visually and thematically coherent whole?
Design and user experience
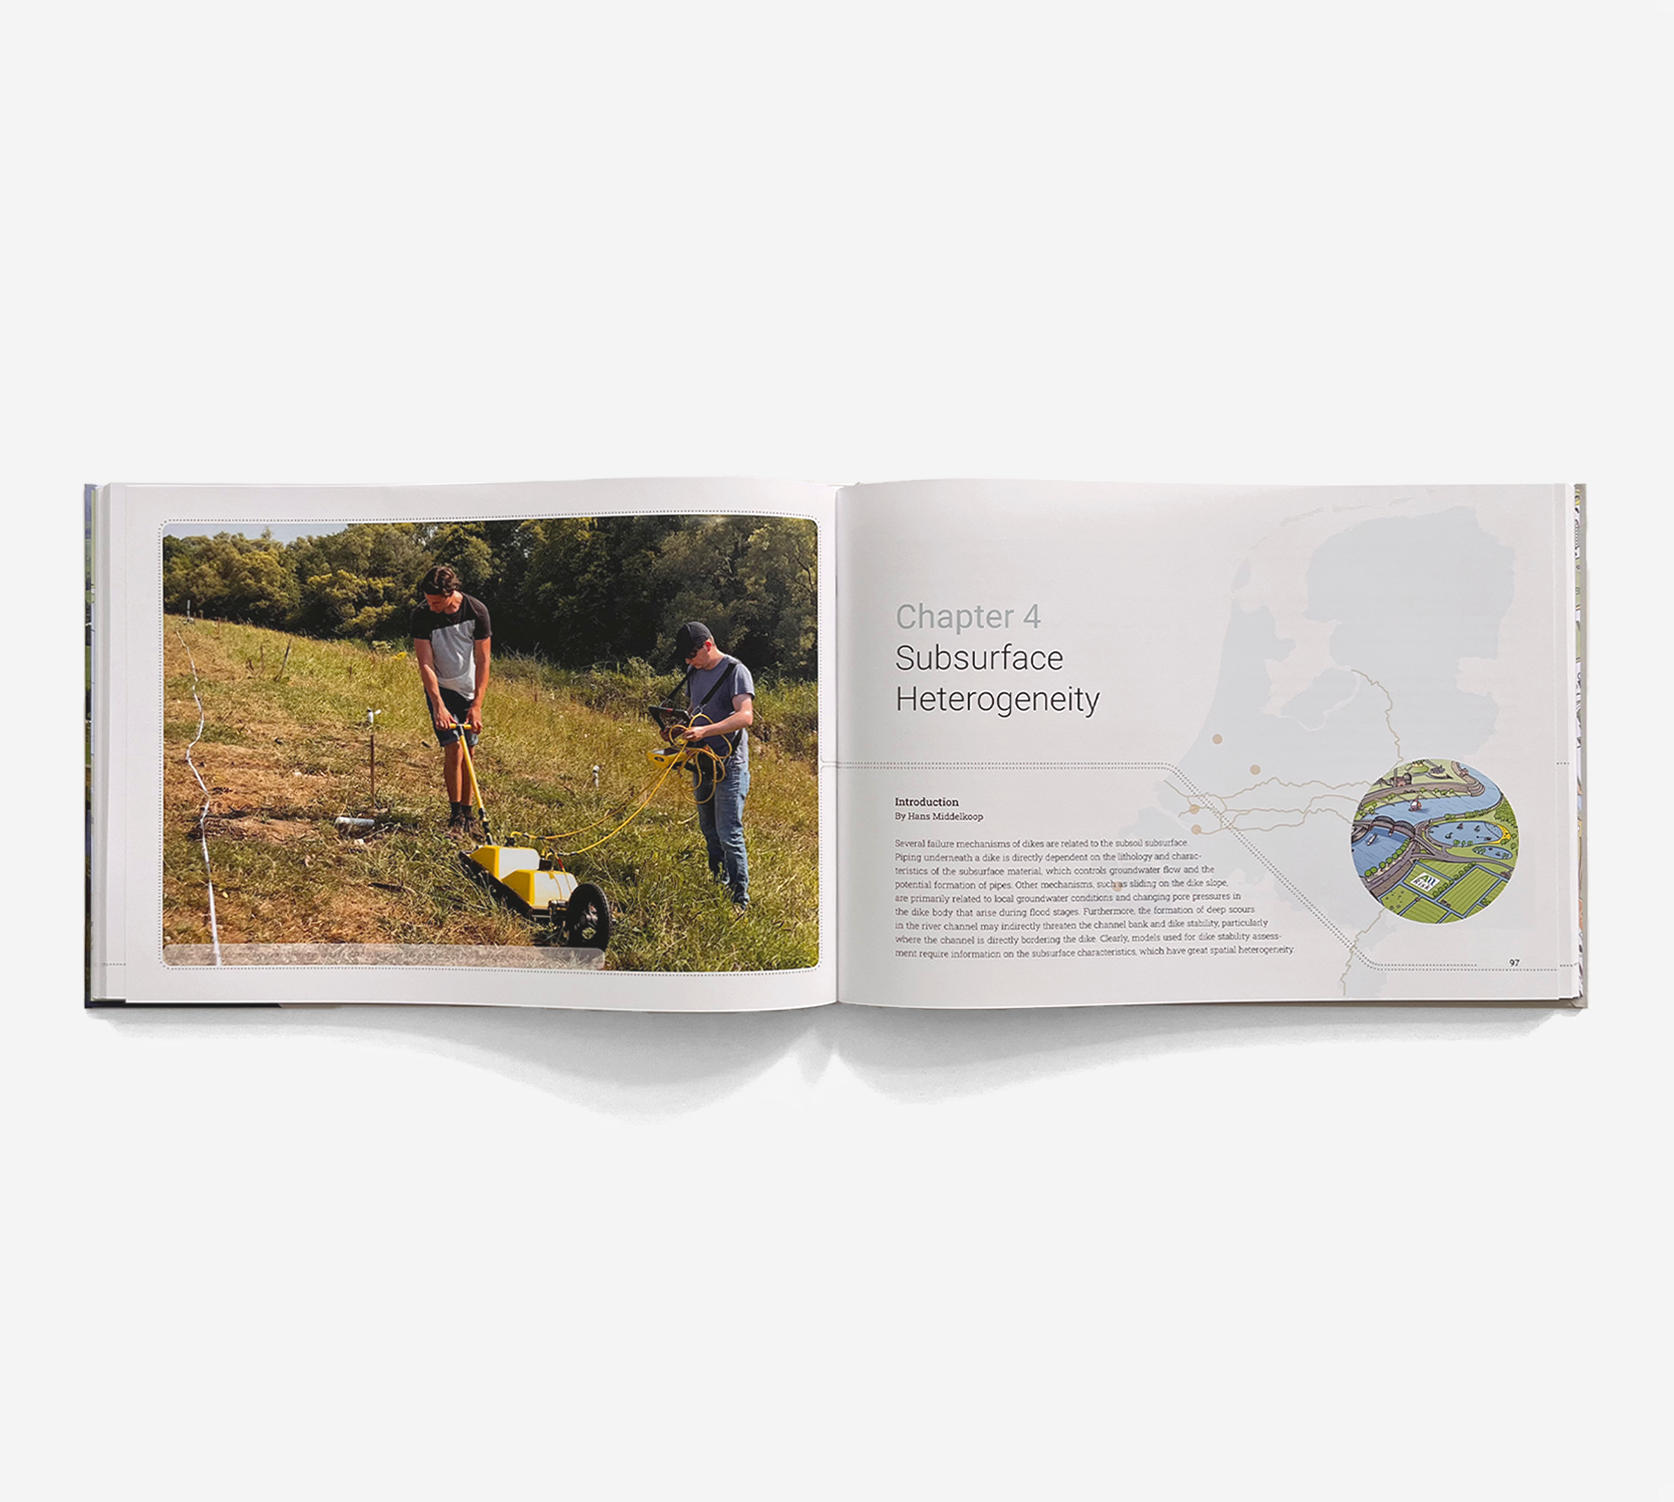
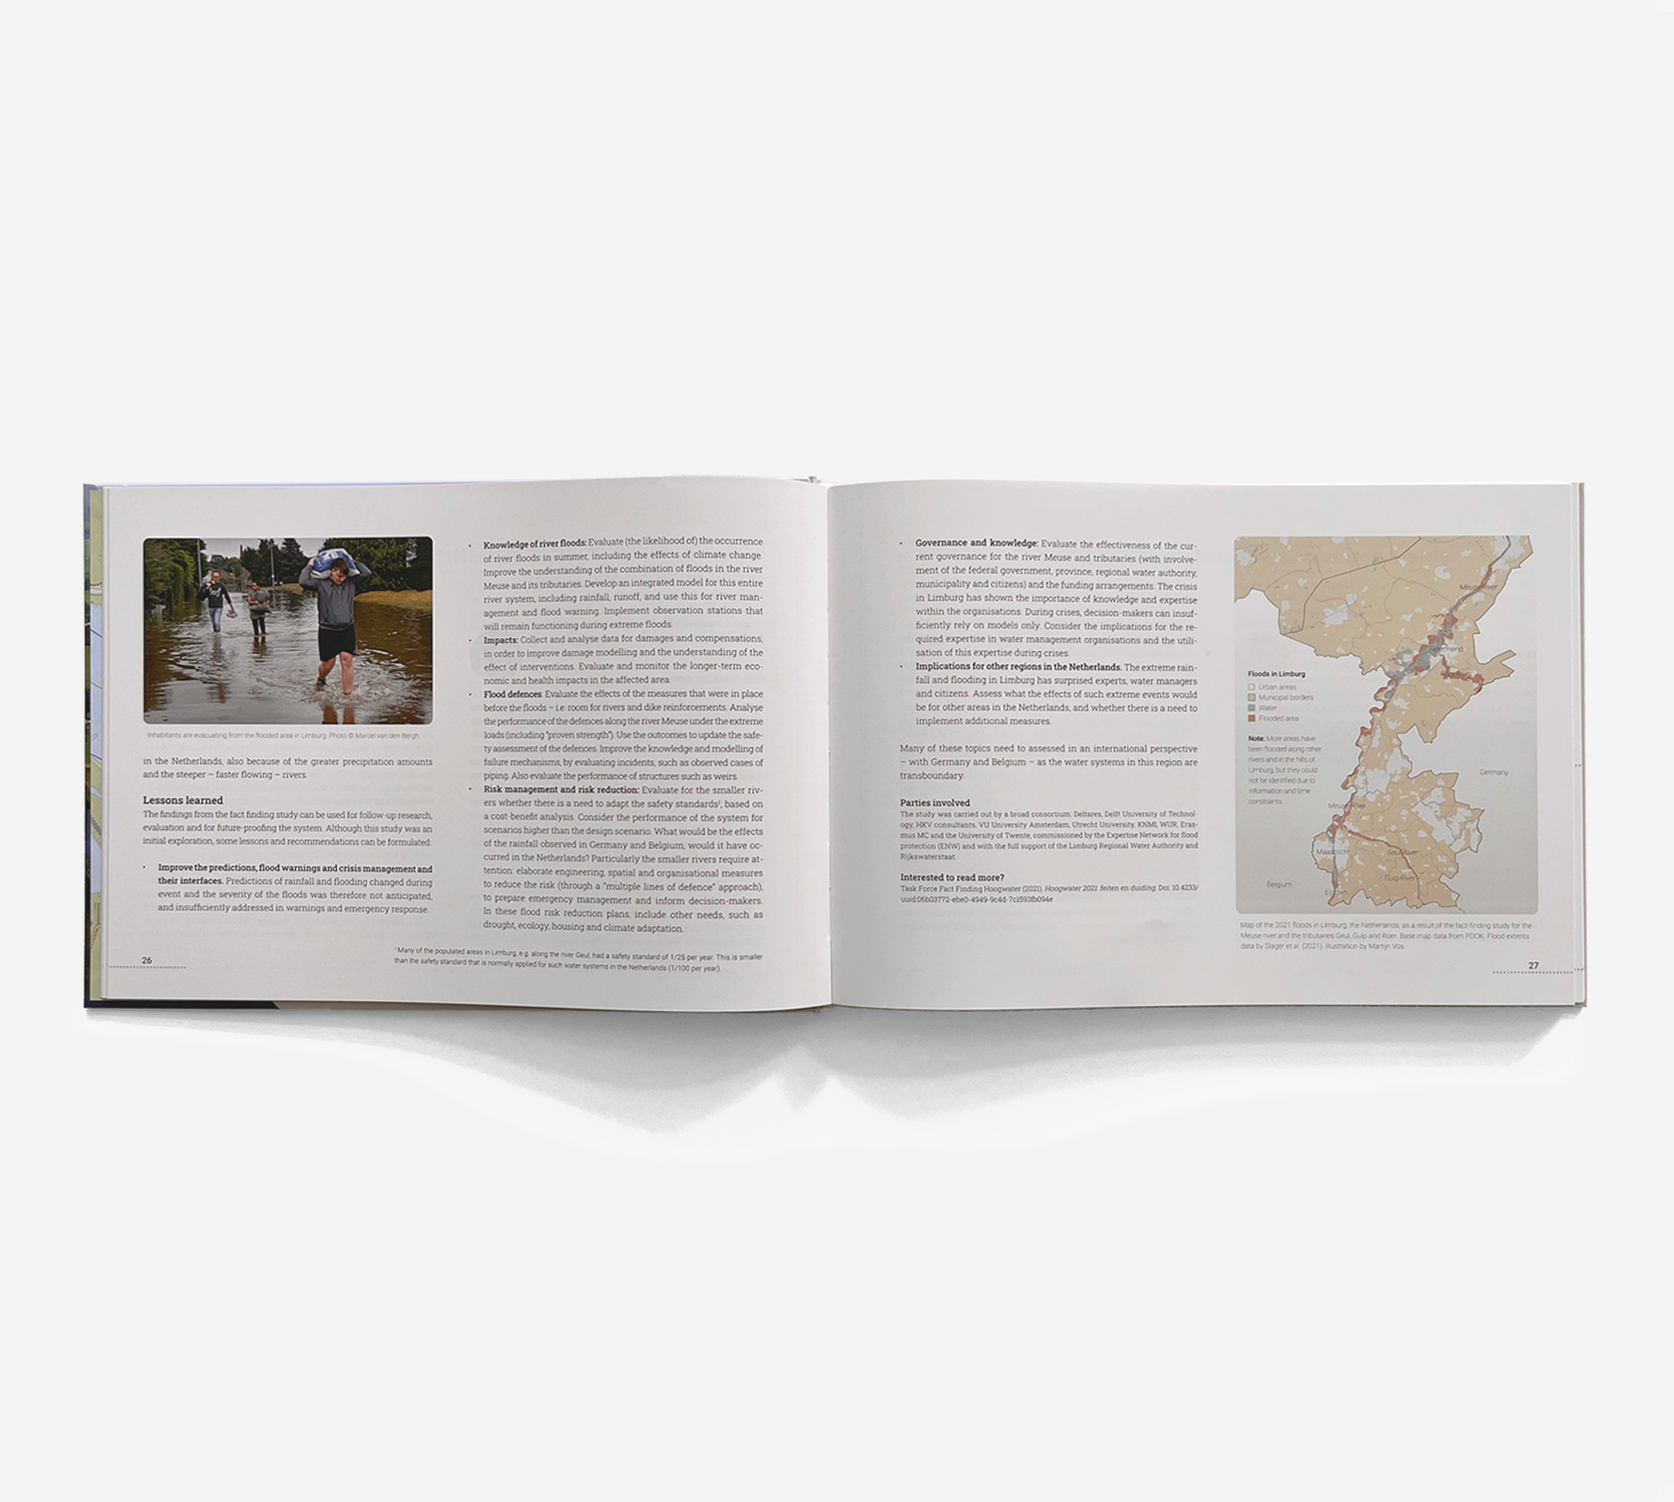
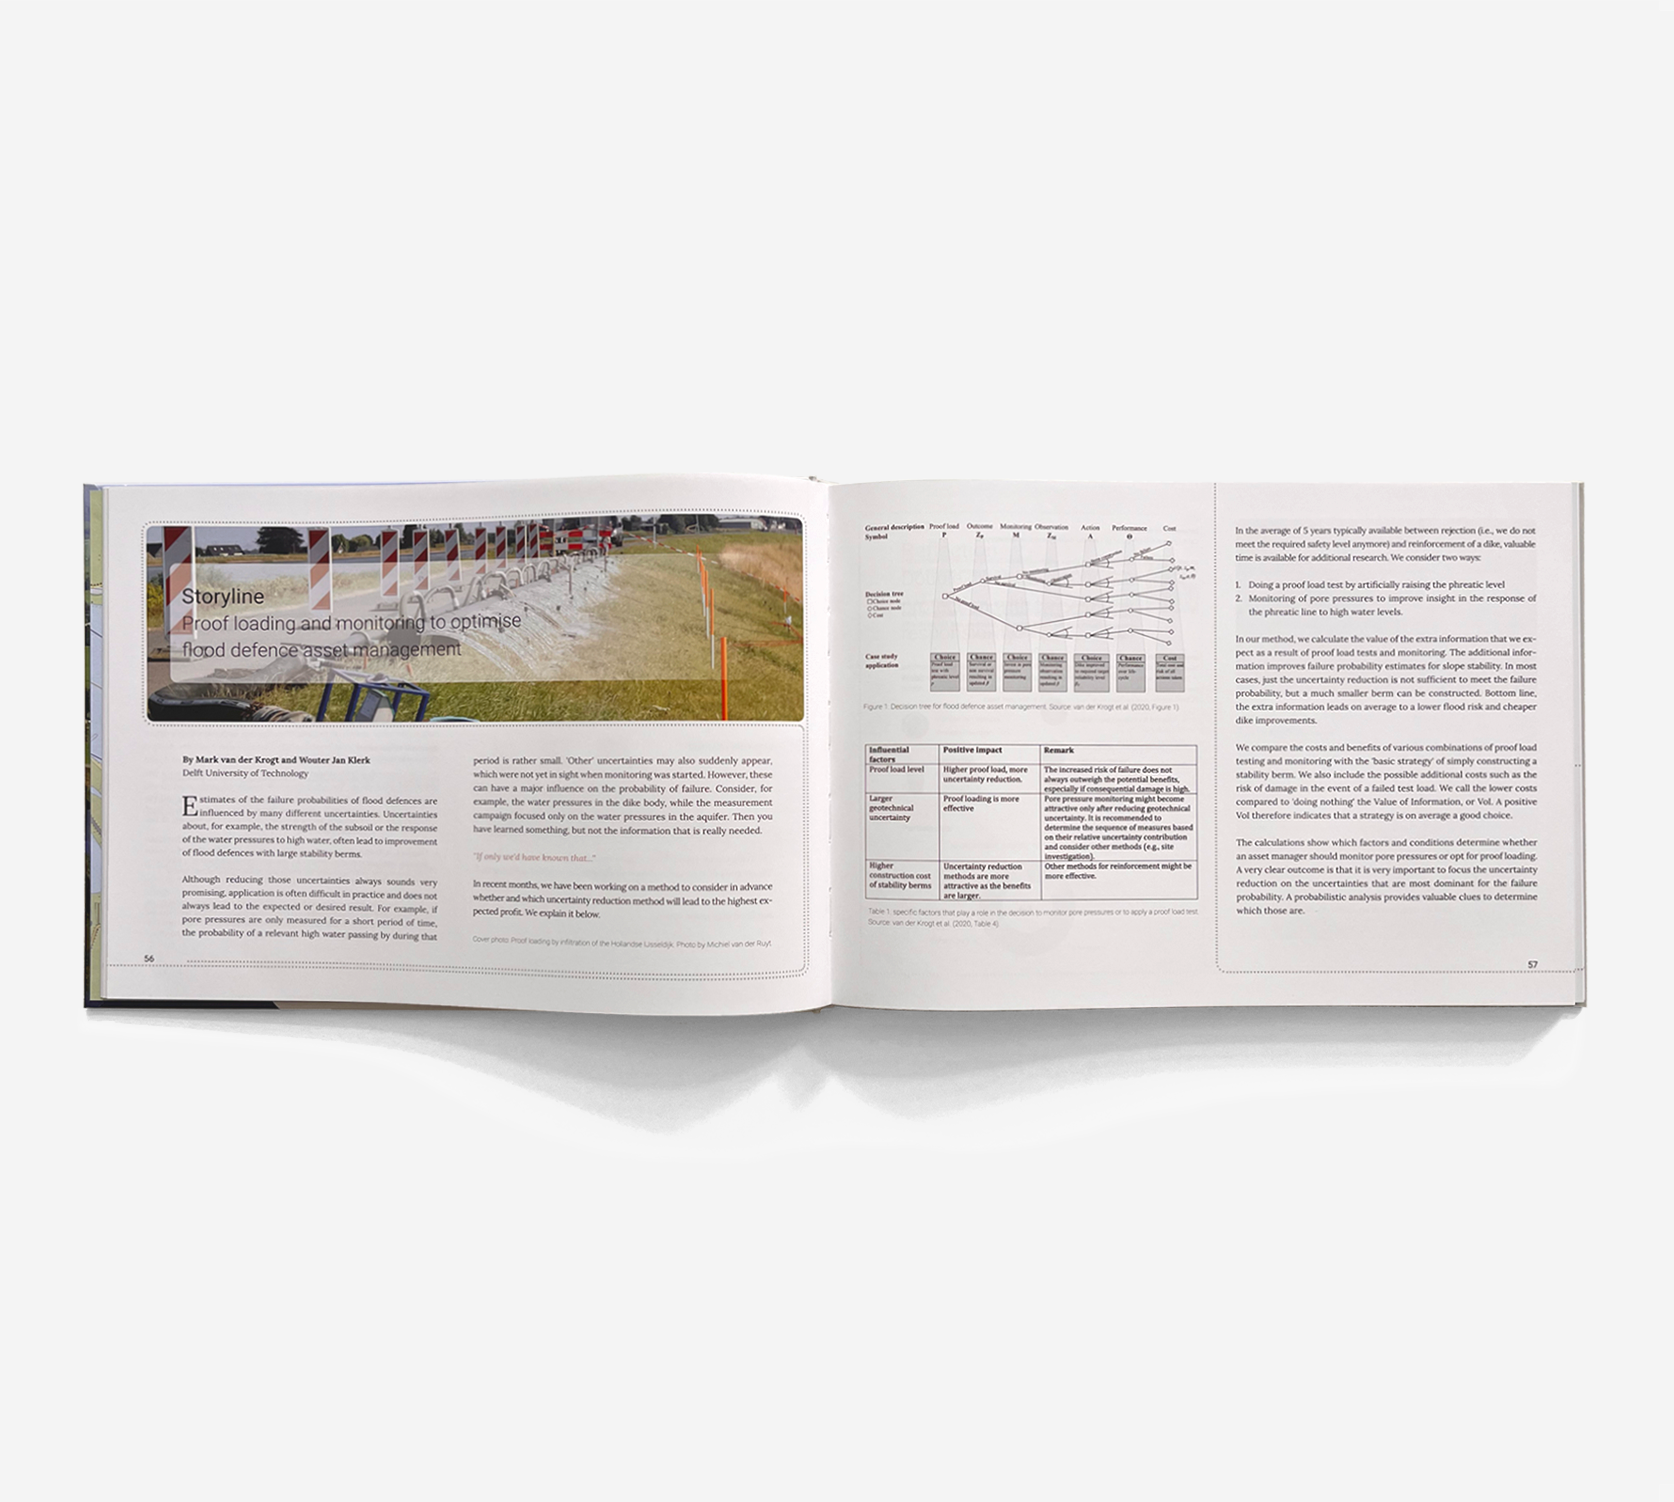
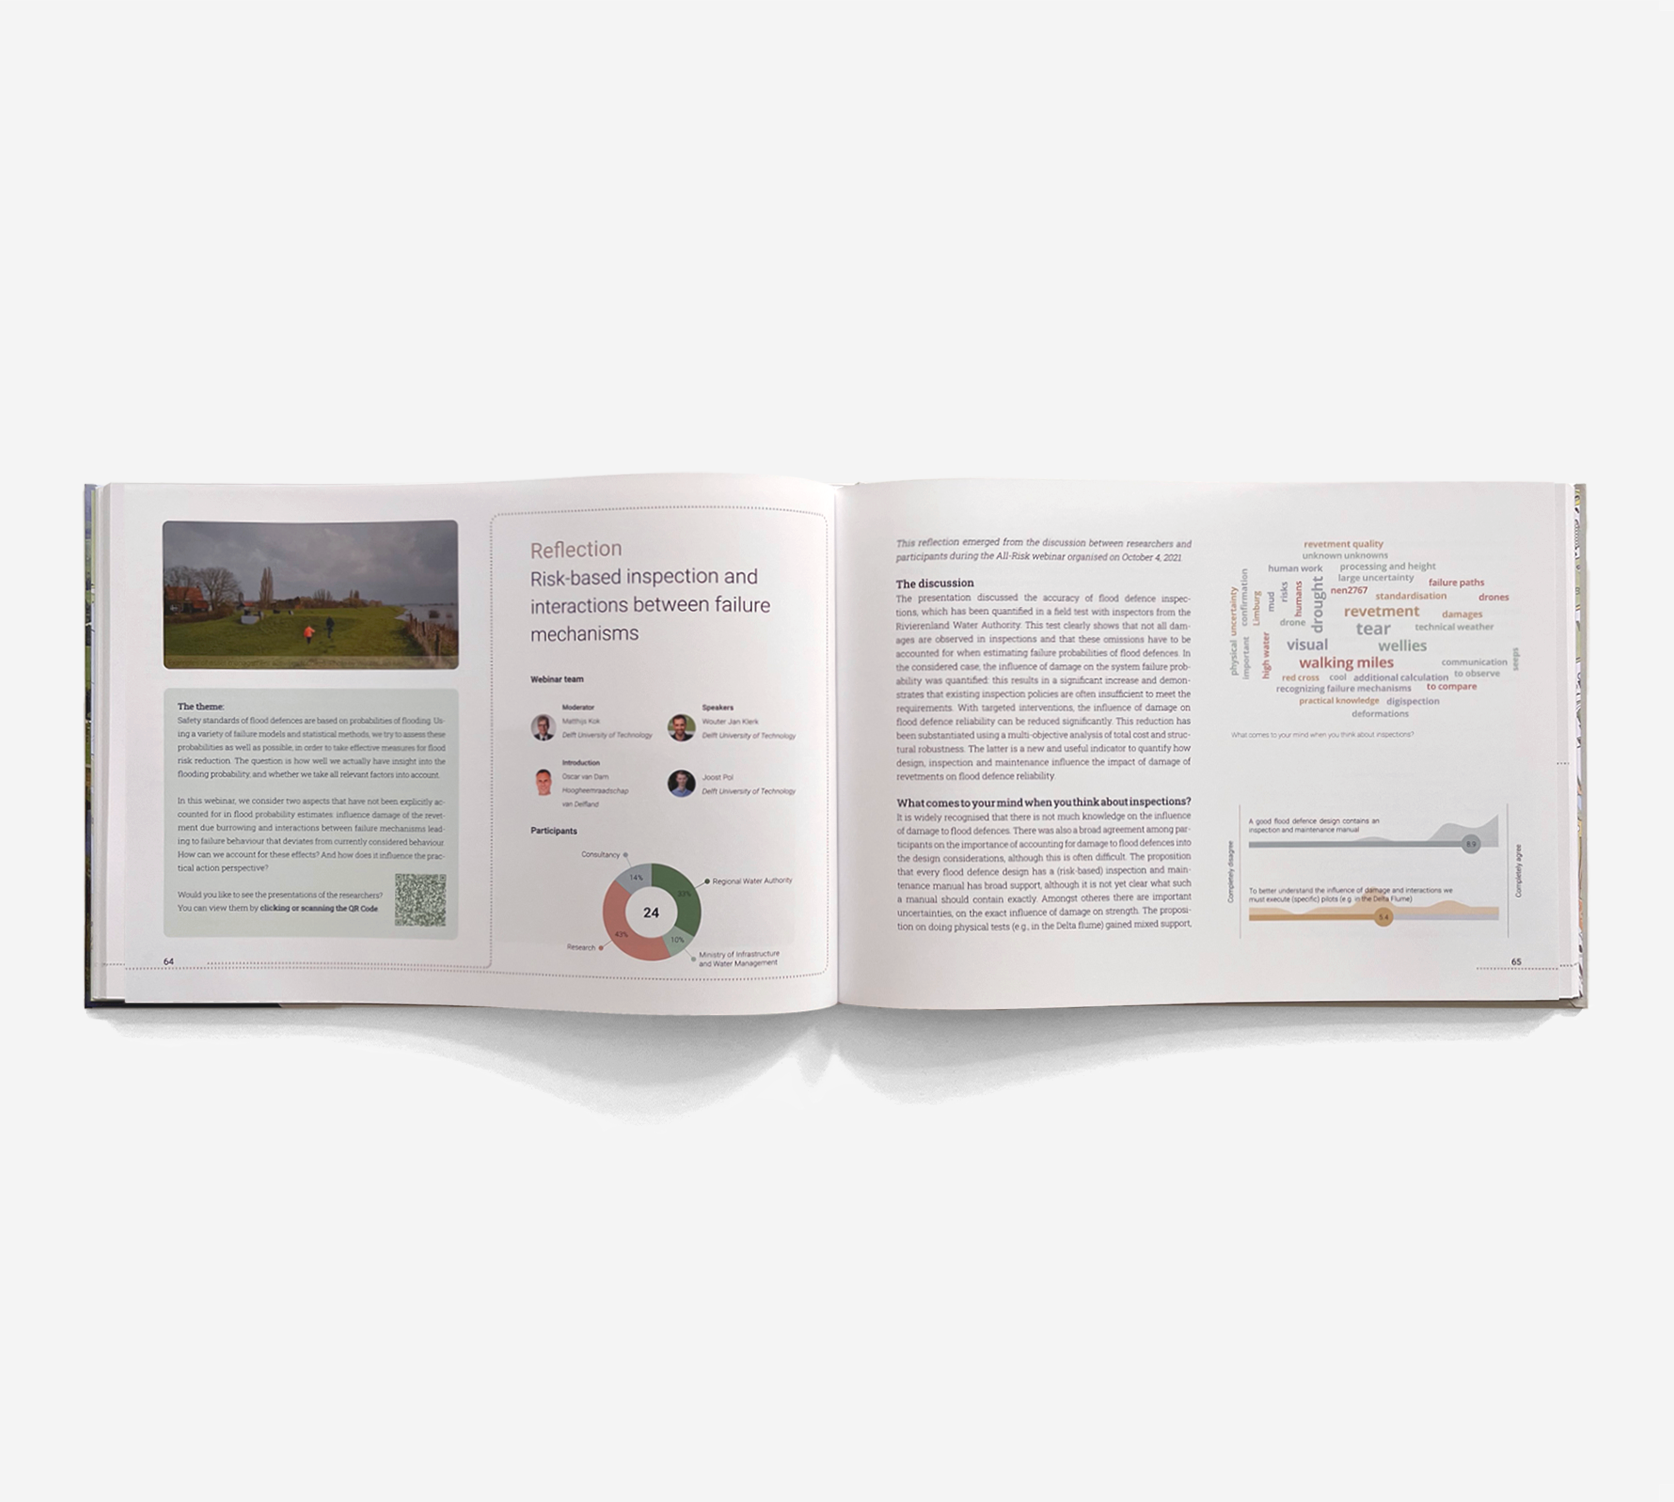
Most of the content already appeared on the website of the research program, where it has been structured based on the type of content. For the book, we first reorganized the content outputs (sections) by structuring them thematically. For each type of section I then designed a distinctive layout and visual identity, to first create a sense of recognition for each content type while scanning the book, and then – while reading – to offer a different reading experience based on the nature of the content, since there is a large variety of more (academic) magazine-like and opinion articles, storytelling, and theoretical research outputs. The organization and visual identity of each section reflects this nature.
Linking the themes
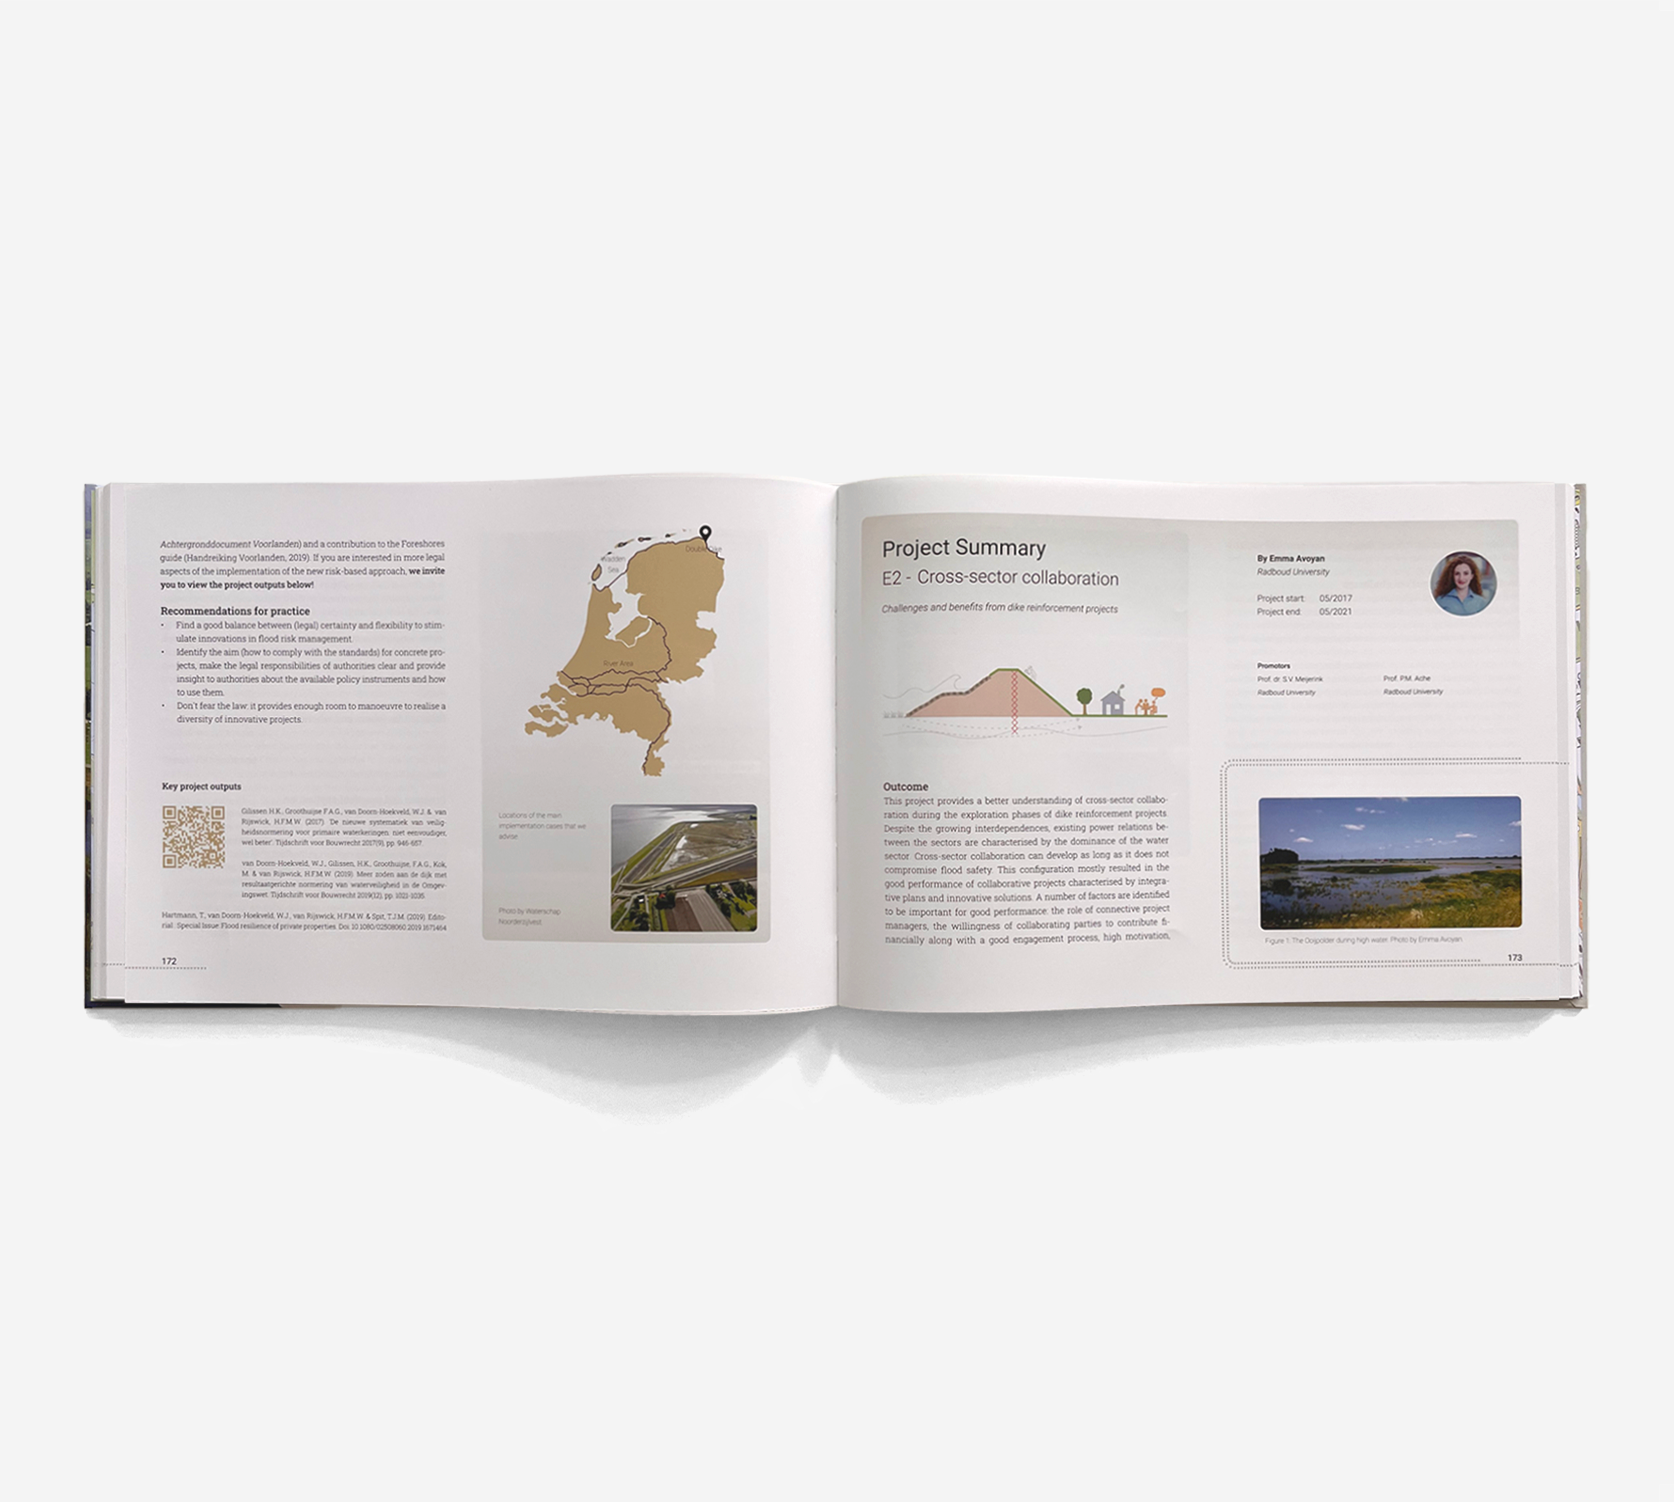
So, every thematic chapter now followed the same logic and order. However, the next challenge was to link the different themes and their outputs together, since many projects contained overlapping subjects. First of all, we linked the project locations together by creating a map in the table of contents that lists the projects belonging to each key project location.
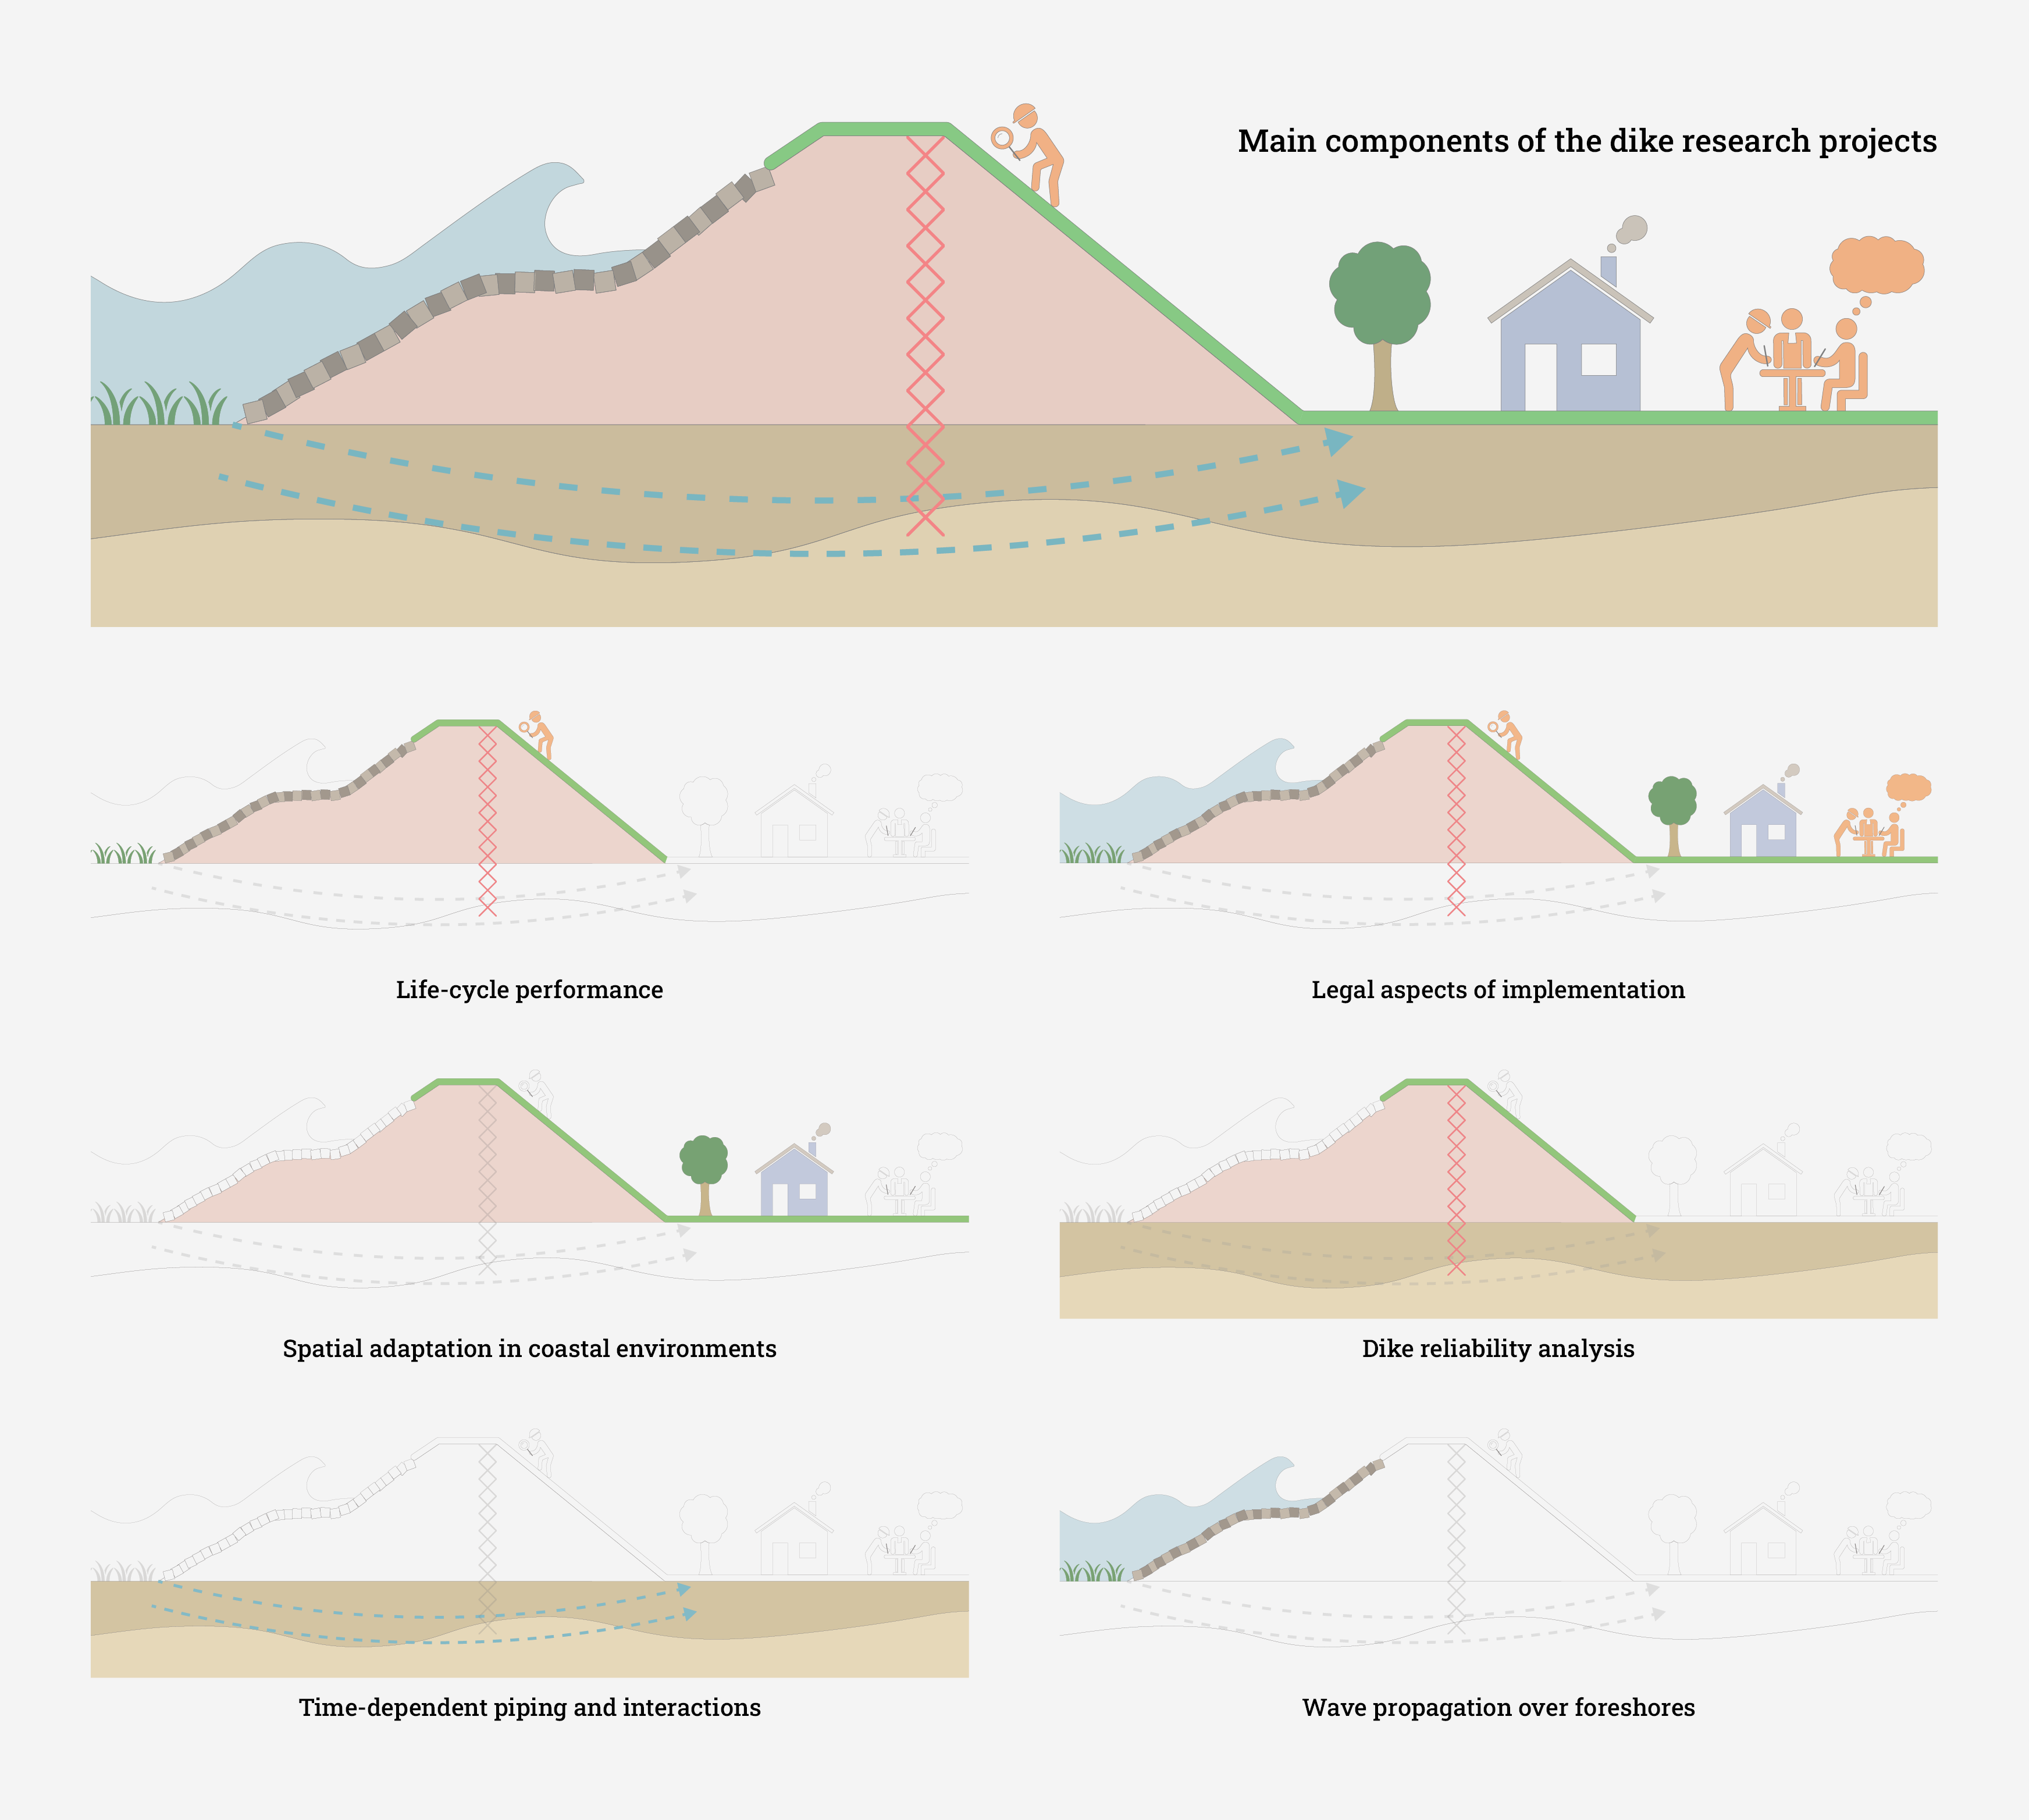
Secondly, linking all the PhD projects together was done by creating a schematic illustration of a flood defence that appeared at the start of each project summary. The illustration visualizes what parts of the dike have been researched in that project, by coloring these parts of the dike. Now, when scanning the pages, one can quickly see what parts of the flood defence are discussed in each project and which other projects focus on similar parts of the flood defence. The image below gives a few examples of these images.